Trends View
The Trends view shows your spending or income over time as a bar chart. Identify patterns, spot unusual months, and track your progress.
Reading the Chart
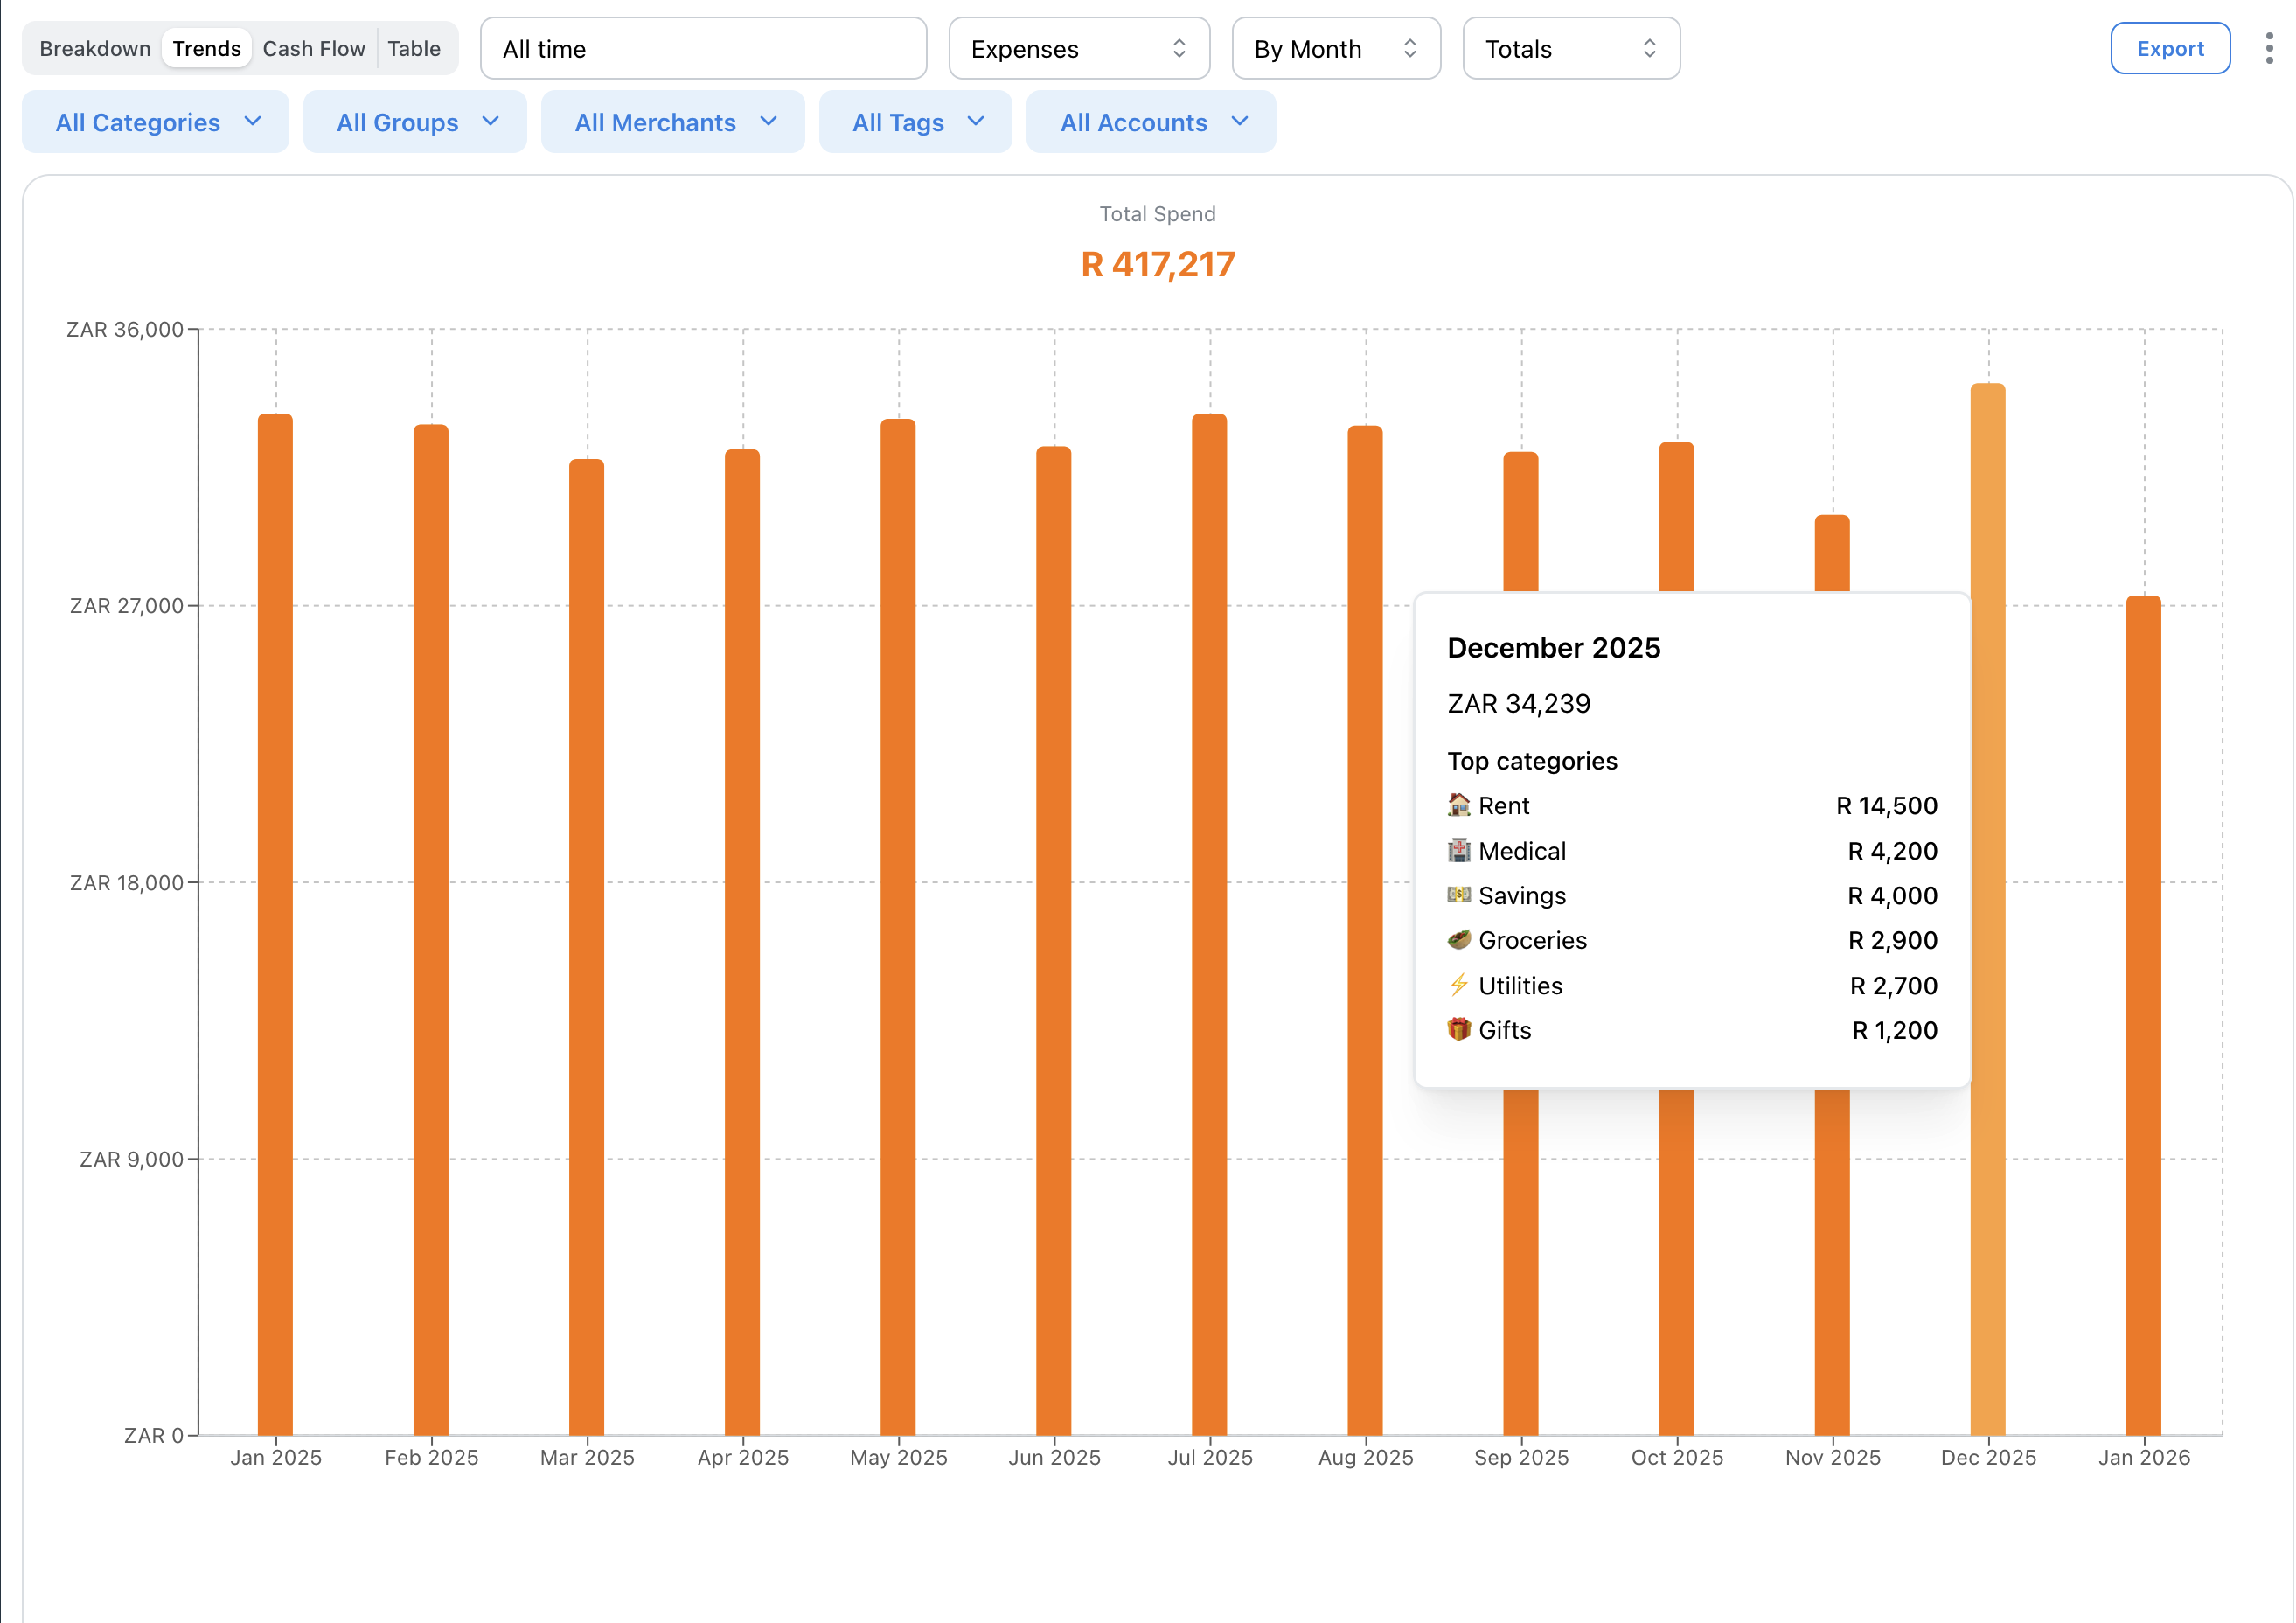
Each bar represents a time period (month or year). Taller bars = more spending.
Hover over bars to see exact amounts.
Click any bar to view transactions for that period.
Time Grouping
Group data by:
• Month - See monthly patterns
• Year - Long-term view of annual spending
Monthly is best for spotting recent trends. Yearly shows the big picture.
Totals vs Cumulative
• Totals - Each bar shows that period's total (default)
• Cumulative - Each bar shows running total over time
Cumulative is useful for tracking progress toward annual goals.
Category Trends
Use the category filter to see trends for specific categories. For example, track how your grocery spending has changed over the past year.
Combine with merchant filter to see spending at specific stores.