FinWise HubTable View
FinWise HubAnalyzeTable View
Table View
1 min read
The Table view shows your data in a spreadsheet format with categories as rows and time periods as columns. Perfect for detailed analysis and comparison.
Understanding the Table
The table shows:
• Rows: Each category
• Columns: Each month (or year)
• Cells: Amount spent/earned in that category for that period
Easily compare spending across categories and time periods.
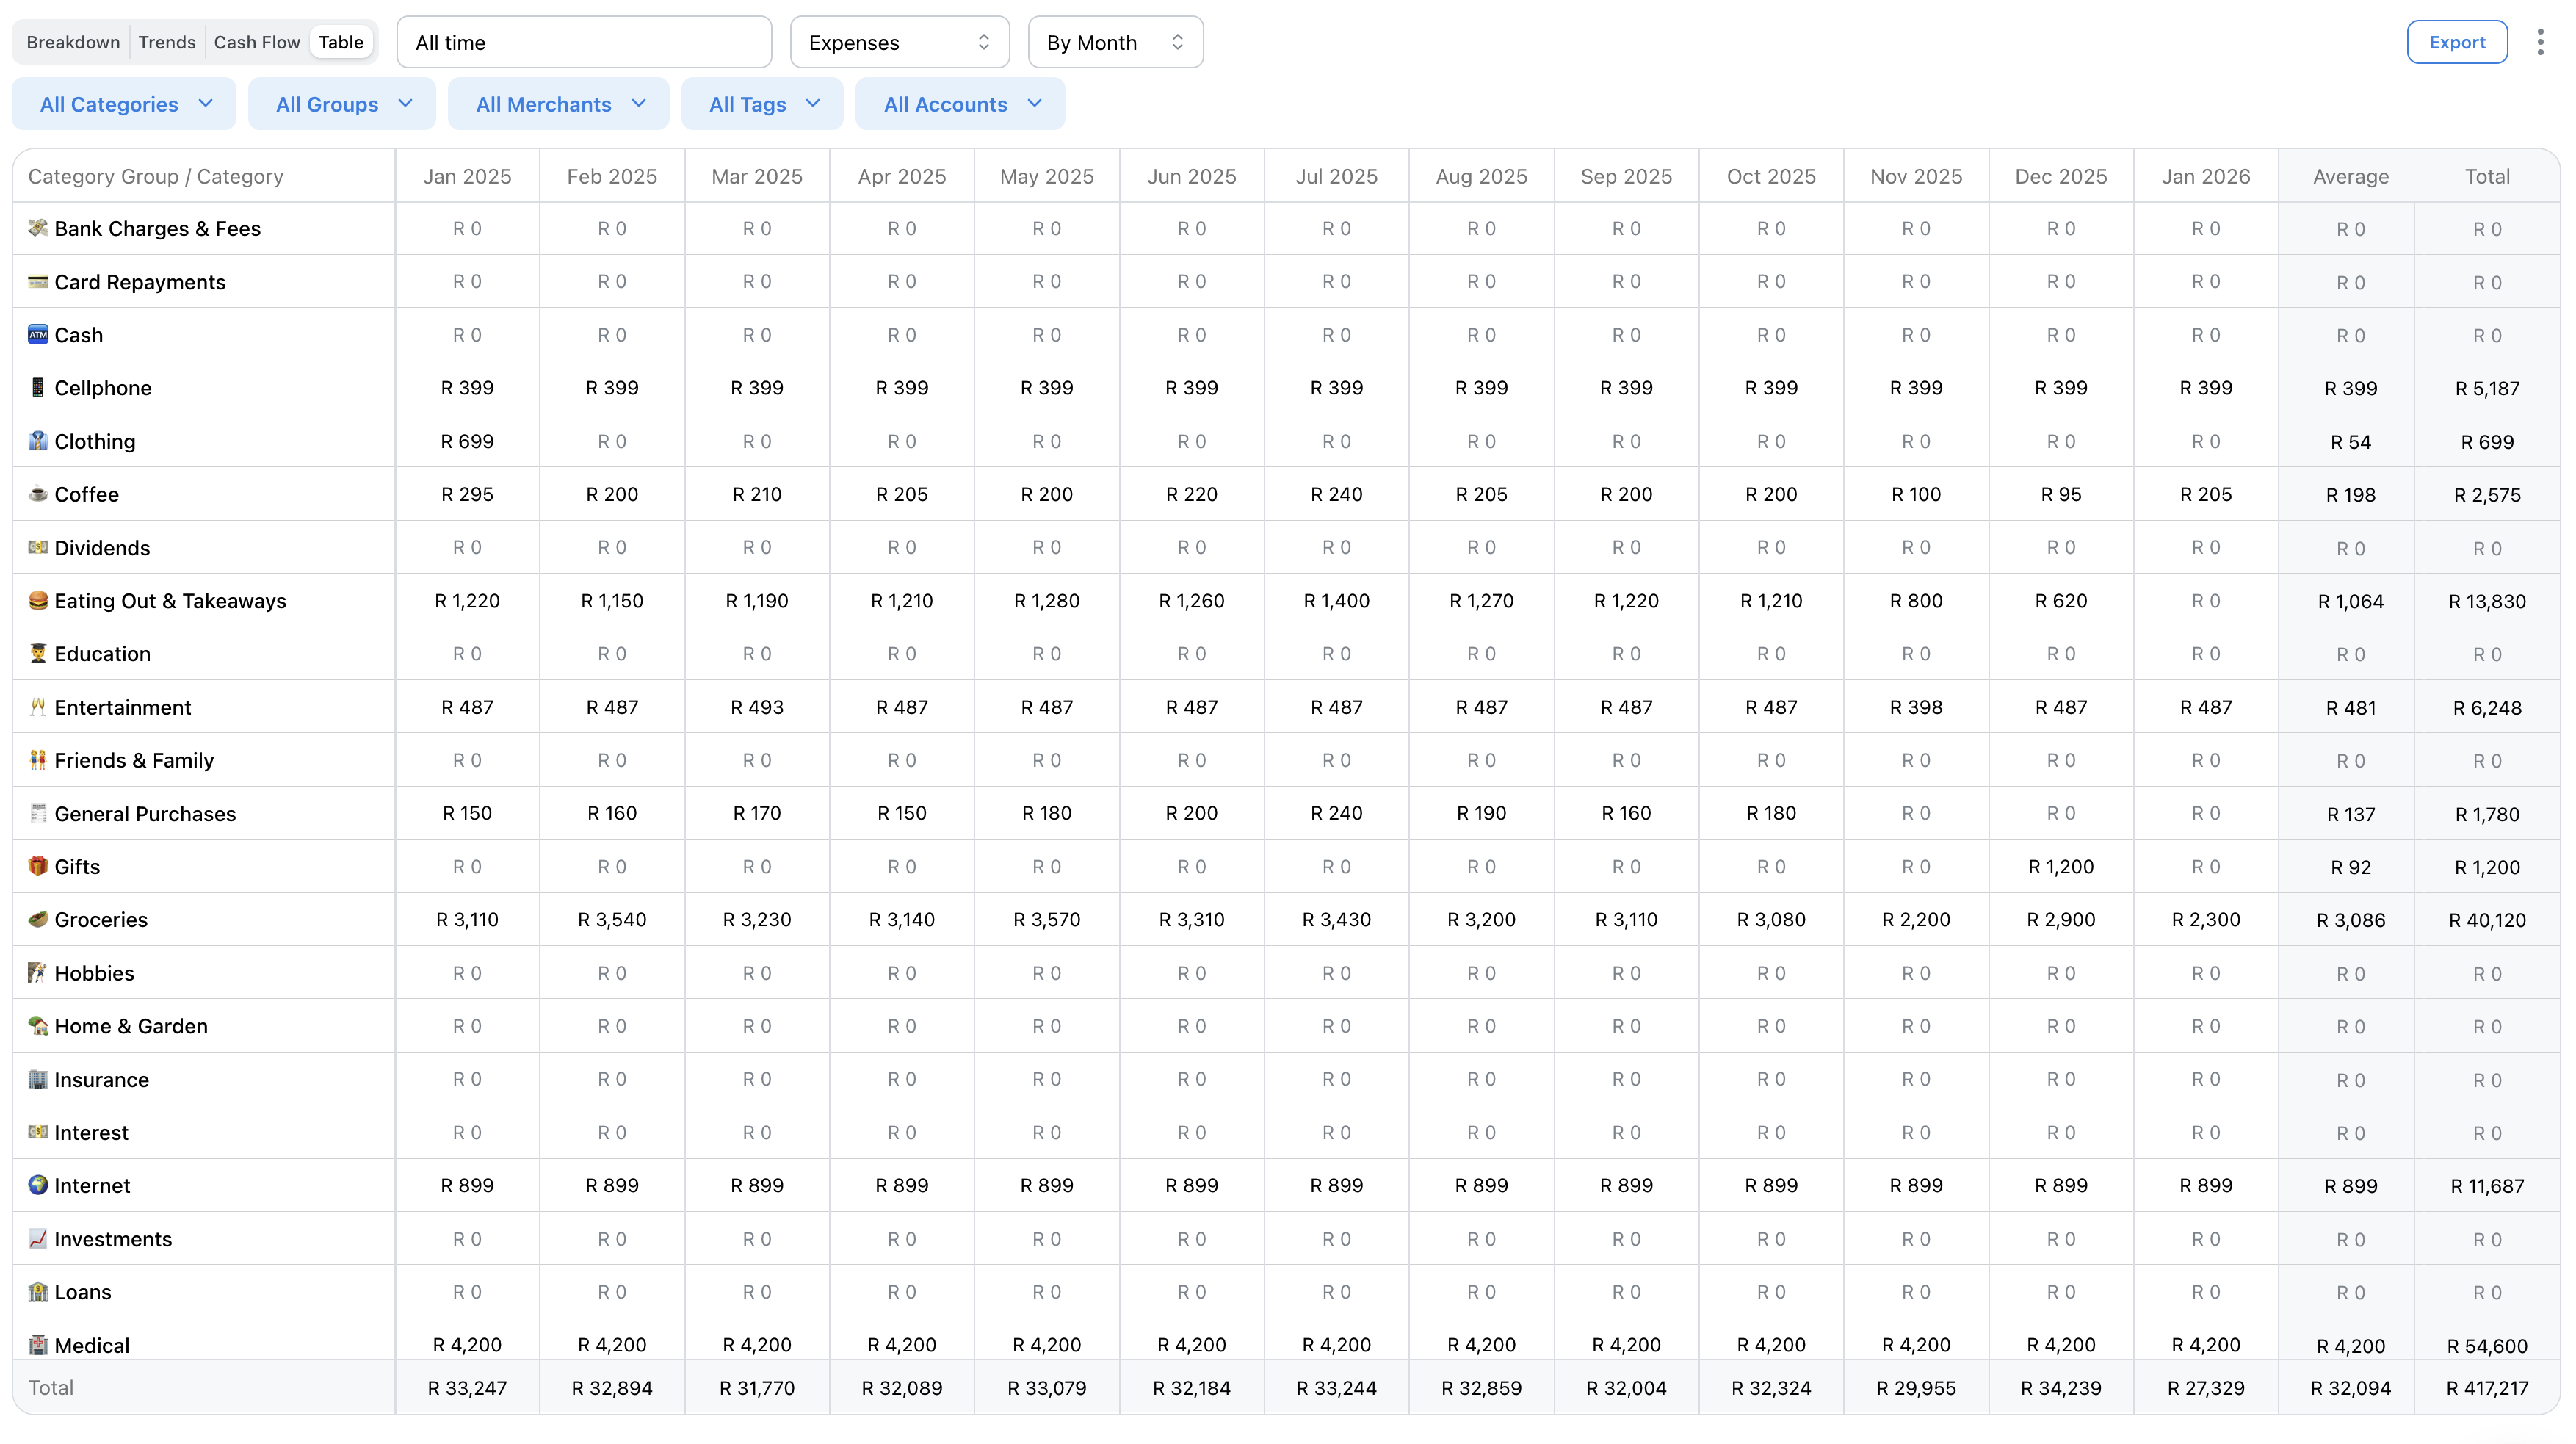
Sorting & Navigation
Click column headers to sort by that period's amounts.
Scroll horizontally to see more months.
Categories are grouped by category groups for organization.
Drilling Down
Click any cell to see the transactions that make up that amount.
Great for investigating unusual spending in specific months.
Exporting
Click Export to download the table as CSV. This is the most detailed export option, perfect for budget reviews or tax preparation.
Related Articles
On this page