Dashboard
The Dashboard gives you a quick snapshot into your finances, including your net worth, budget progress, and spending over time.
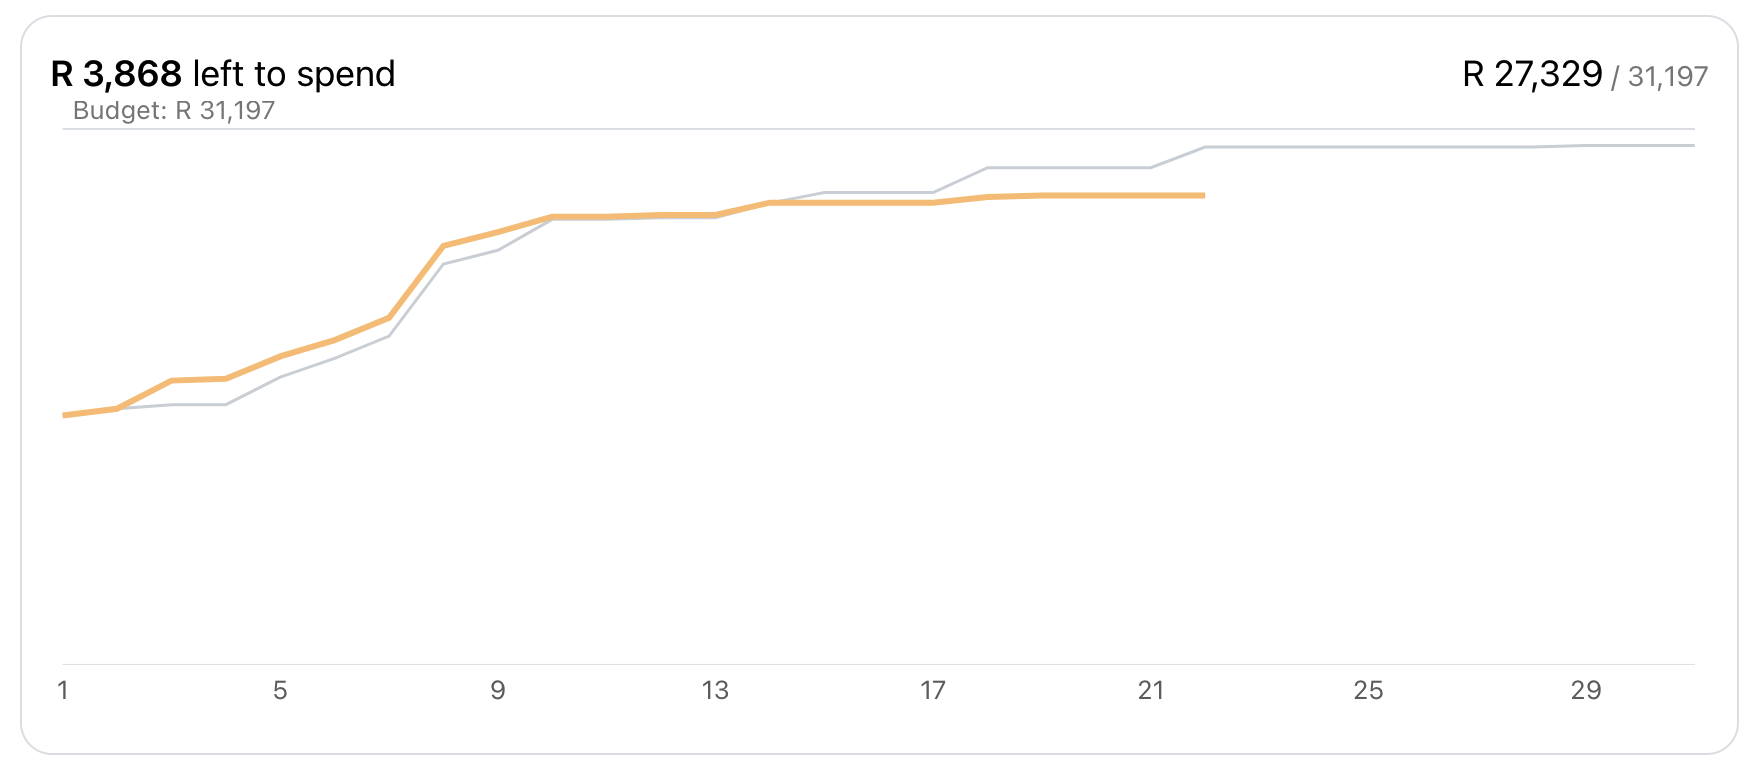
Budget Progress
See at a glance how you're tracking against your budget. Progress bars show green (under budget), yellow (approaching limit), or red (over budget).
Click any budget to go directly to the Budget page for more details.
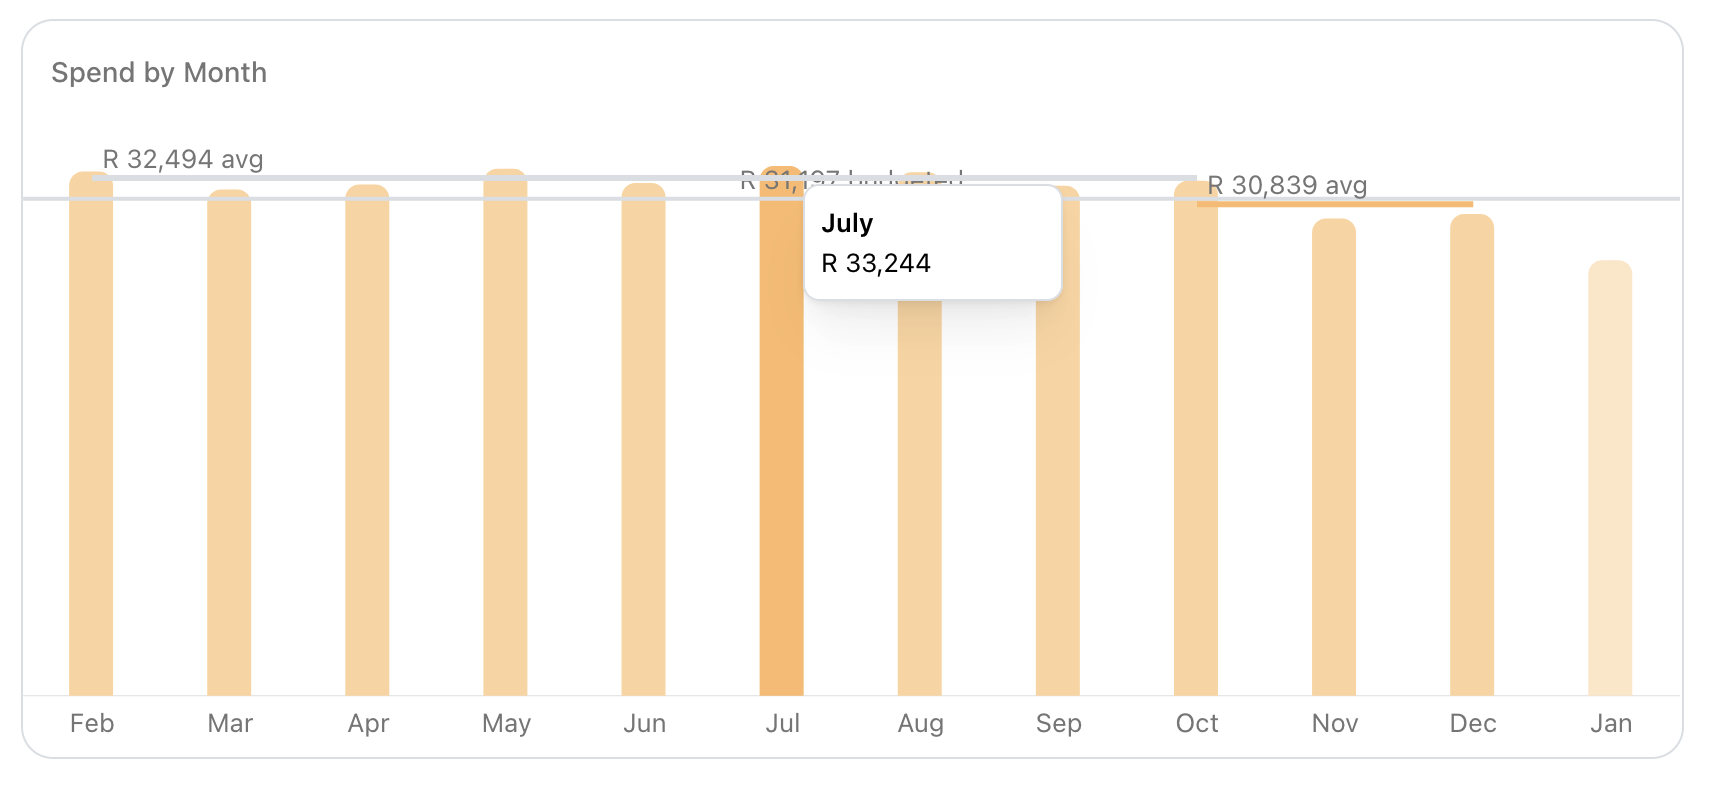
Spending Overview
The spending chart shows how much money you have spent per month.
Hovering over each bar shows you the exact amount you spent per month.
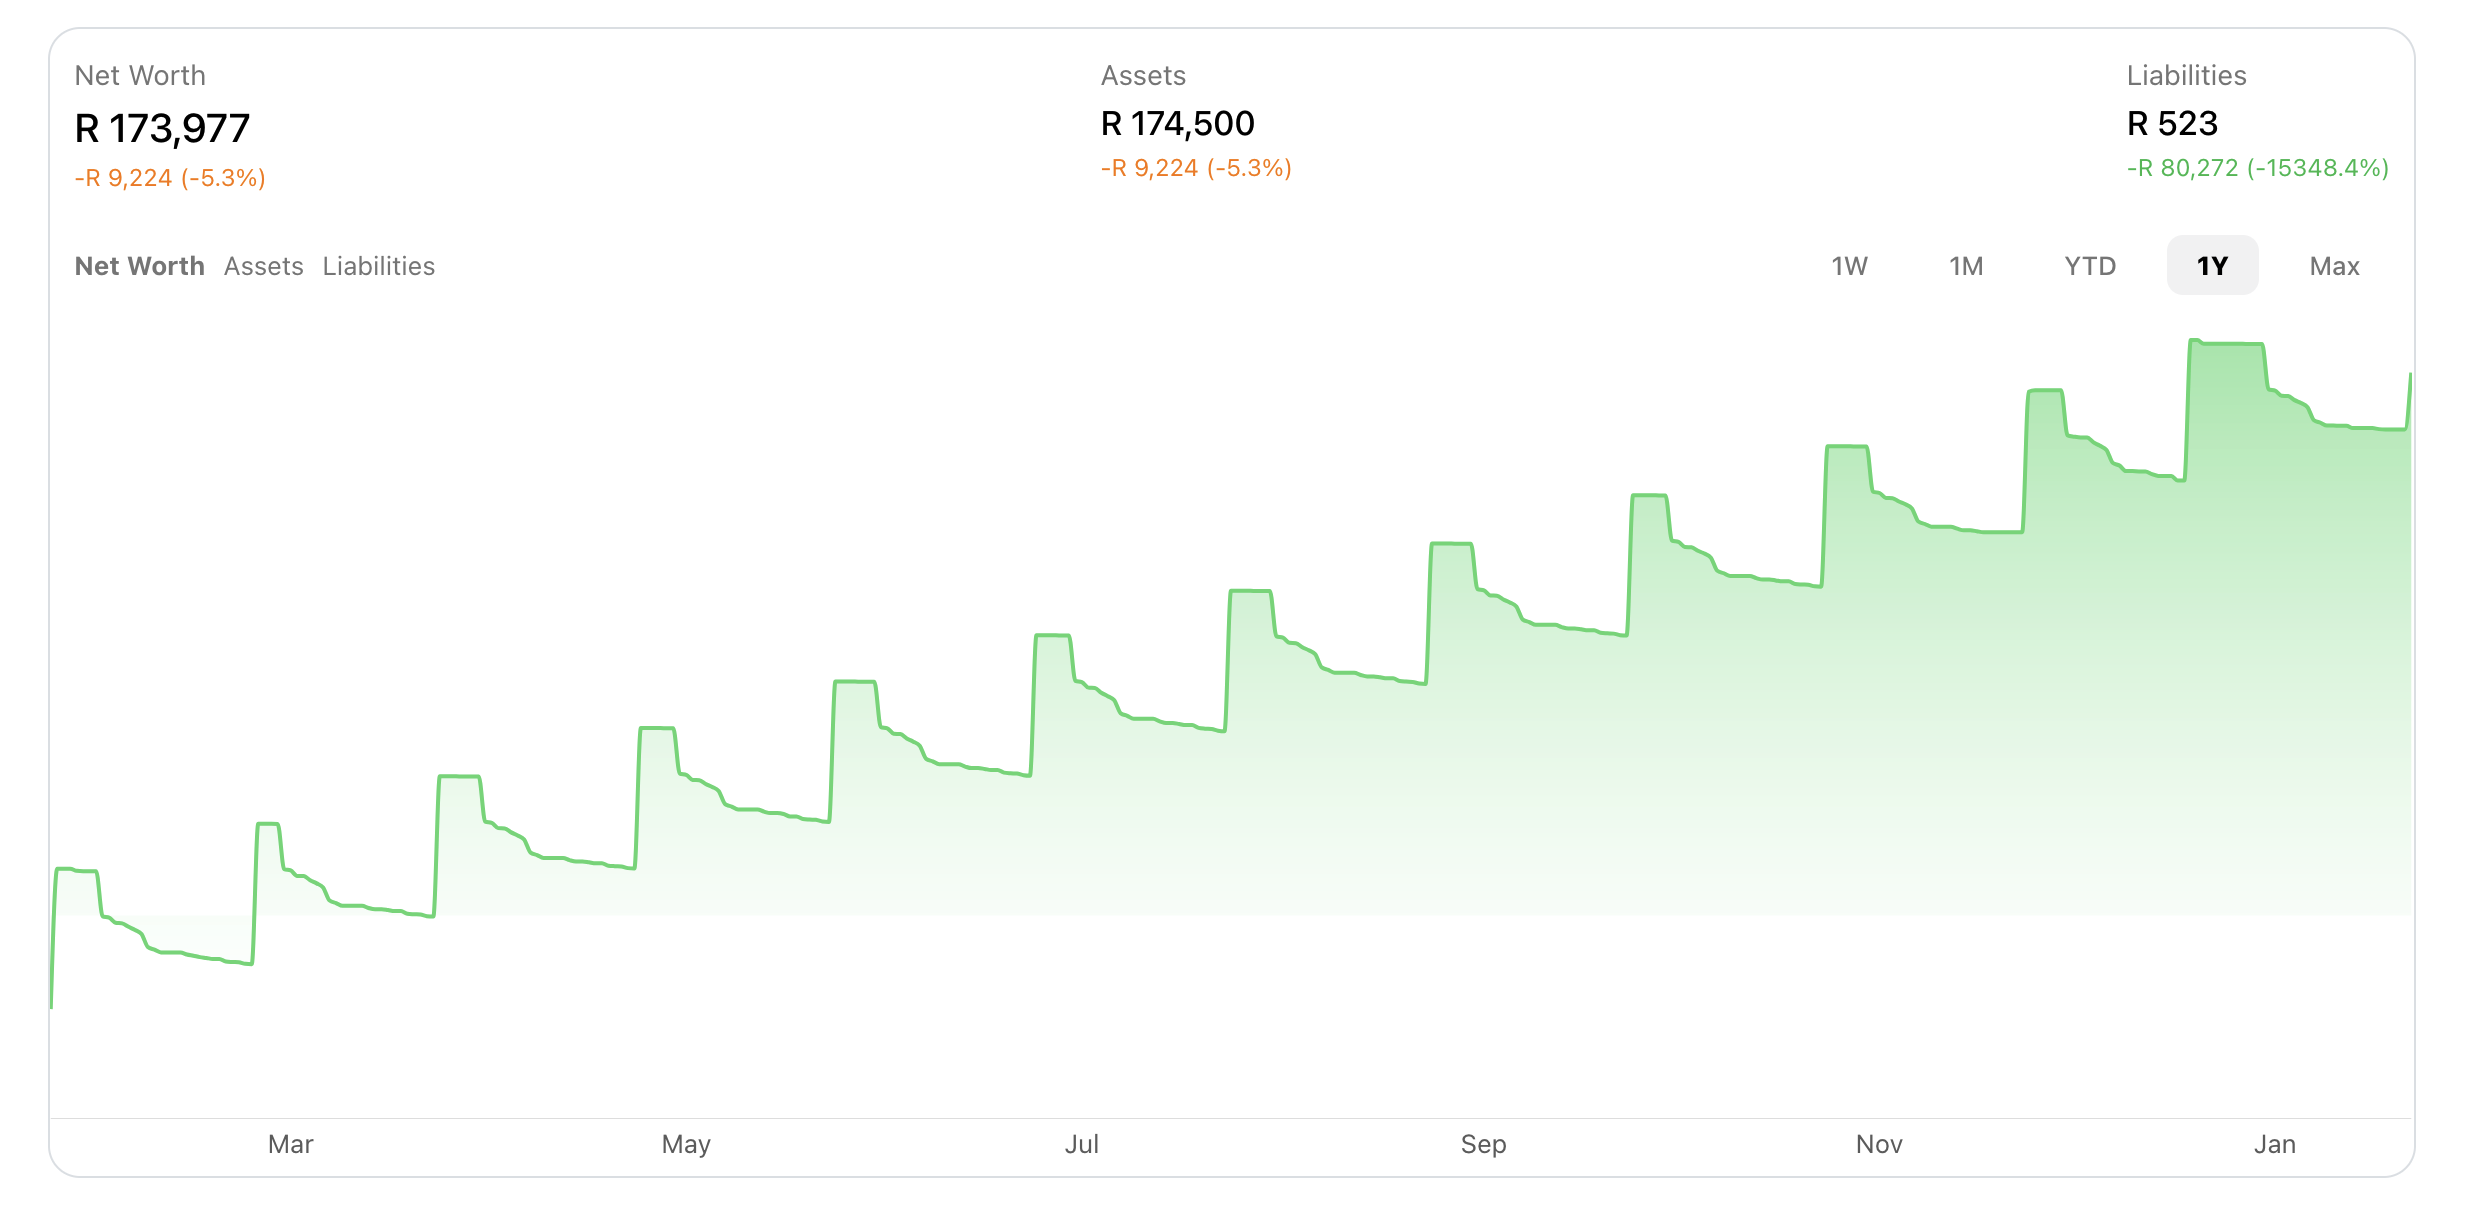
Net Worth Tracking
Your net worth is the total value of your assets minus your liabilities. The dashboard shows your net worth trend over time so you can watch your wealth grow.
FinWise automatically calculates this by adding up all your asset accounts (checking, savings, investments, property) and subtracting your liabilities (loans, credit card debt).
You can exclude specific accounts from your net worth calculation by toggling the setting from the advanced settings on a specific account.